Articles by "Data Analysis"

Showing posts with label Data Analysis. Show all posts

John Sall, Mia L. Stephens, Ann Lehman, Sheila Loring ... 1017 pages - Language: English - Publisher: SAS Institute; 6th edition (February, 2017).


This book provides hands-on tutorials with just the right amount of conceptual and motivational material to illustrate how to use the intuitive interface for data analysis in JMP. Each chapter features concept-specific tutorials, examples, brief reviews of concepts, step-by-step illustrations, and exercises.Updated for JMP 13, JMP Start Statistics, Sixth Edition includes many new features, including: The redesigned Formula Editor. + New and improved ways to create formulas in JMP directly from the data table or dialogs. + Interface updates, including improved menu layout. + Updates and enhancements in many analysis platforms. + New ways to get data into JMP and to save and share JMP results. + Many new features that make it easier to use JMP.

Wengang Zhang ... 240 pages - Publisher: Springer; (April, 2019) ... Language: English - AmazonSIN: B07R93QW6S.

This book presents the application of a comparatively simple nonparametric regression algorithm, known as the multivariate adaptive regression splines (MARS) surrogate model, which can be used to approximate the relationship between the inputs and outputs, and express that relationship mathematically. The book first describes the MARS algorithm, then highlights a number of geotechnical applications with multivariate big data sets to explore the approach’s generalization capabilities and accuracy. As such, it offers a valuable resource for all geotechnical researchers, engineers, and general readers interested in big data analysis.

Daniel Chen ... 416 pages ... Publisher: Addison-Wesley Professional; (December, 2017) ... Language: English - ISBN-10: 0134546938.

Today, analysts must manage data characterized by extraordinary variety, velocity, and volume. Using the open source Pandas library, you can use Python to rapidly automate and perform virtually any data analysis task, no matter how large or complex. Pandas can help you ensure the veracity of your data, visualize it for effective decision-making, and reliably reproduce analyses across multiple datasets. Pandas for Everyone brings together practical knowledge and insight for solving real problems with Pandas, even if you’re new to Python data analysis. Daniel Y. Chen introduces key concepts through simple but practical examples, incrementally building on them to solve more difficult, real-world problems. Chen gives you a jumpstart on using Pandas with a realistic dataset and covers combining datasets, handling missing data, and structuring datasets for easier analysis and visualization. He demonstrates powerful data cleaning techniques, from basic string manipulation to applying functions simultaneously across dataframes.

Once your data is ready, Chen guides you through fitting models for prediction, clustering, inference, and exploration. He provides tips on performance and scalability, and introduces you to the wider Python data analysis ecosystem.: Work with DataFrames and Series, and import or export data + Create plots with matplotlib, seaborn, and pandas + Combine datasets and handle missing data + Reshape, tidy, and clean datasets so they’re easier to work with + Convert data types and manipulate text strings + Apply functions to scale data manipulations + Aggregate, transform, and filter large datasets with groupby + Leverage Pandas’ advanced date and time capabilities + Fit linear models using statsmodels and scikit-learn libraries + Use generalized linear modeling to fit models with different response variables + Compare multiple models to select the “best” + Regularize to overcome overfitting and improve performance + Use clustering in unsupervised machine learning.

Statgraphics Centurion 19.1.1 for x64 [Size: 188 MB] ... Statgraphics Centurion 18 is a comprehensive Windows desktop product for statistical analysis, data visualization and predictive analytics. It contains over 260 procedures covering a wide range of data analysis techniques. Statgraphics 18 features an easy-to-use GUI that does not require learning a complicated command language. Especially helpful to practitioners is the StatAdvisor, which explains the results of statistical analyses in a manner suitable for presentation to non-statisticians. Statgraphics 18 is a major upgrade that contains many new features, including: A new file format for handling big data. The 64-bit version can now analyze datasets containing in excess of 100 million rows. * 9 new interactive Statlets for dynamic data visualization, including sunflower plots, population pyramids, wind roses, and violin plots. * Improved demographic maps, with support for SHP files. * Dialog-box driven procedures for accessing R libraries to use classification and regression trees (CART), text mining, multidimensional scaling, analysis of arbitrarily censored data, and seasonal adjustment with X-13ARIMA-SEATS. * Over a dozen other new statistical procedures, including equivalence analysis and noninferiority testing, orthogonal regression, capability control charts, multivariate tolerance intervals, tests for multivariate normality, and random number generation for multivariate normal distributions. * New definitive screening designs in the DOE Wizard.* A new network installation program which allows users to check out seats for use on individual computers. * Extensive enhancements to the process capability analysis procedures to implement the methods described in the new book by Dr. Neil W. Polhemus, Process Capability Analysis: Estimating Quality to be published by Chapman and Hall/CRC Press in December, 2017.

Kaushik Kumar, J. Paulo Davim ... 179 pages - AmazonSIN: B07V7SN988 ... Publisher: Wiley-ISTE; (July, 2019) - Language: English.


Optimization is central to any problem involving decision-making in engineering. Optimization theory and methods deal with selecting the best option regarding the given objective function or performance index. New algorithmic and theoretical techniques have been developed for this purpose, and have rapidly diffused into other disciplines. As a result, our knowledge of all aspects of the field has grown even more profound. In Optimization for Engineering Problems, eminent researchers in the field present the latest knowledge and techniques on the subject of optimization in engineering. Whereas the majority of work in this area focuses on other applications, this book applies advanced and algorithm-based optimization techniques specifically to problems in engineering.

Dirk P. Kroese; Zdravko I. Botev; Thomas Taimre; Radislav Vaisman .... 532 pages - Language: English - AmazonSIN: B081S6BQ2Y - Publisher: Chapman and Hall/CRC; (November, 2019).


The purpose of Data Science and Machine Learning: Mathematical and Statistical Methods is to provide an accessible, yet comprehensive textbook intended for students interested in gaining a better understanding of the mathematics and statistics that underpin the rich variety of ideas and machine learning algorithms in data science. Key Features: Focuses on mathematical understanding. + Presentation is self-contained, accessible, and comprehensive. + Extensive list of exercises and worked-out examples. + Many concrete algorithms with Python code. + Full color throughout.

Steven W. Knox ... Language: English - AmazonSIN: B07BHYKL4V ... 516 pages - Publisher: Wiley; (March, 2018).


Machine Learning: a Concise Introduction offers a comprehensive introduction to the core concepts, approaches, and applications of machine learning. The author—an expert in the field—presents fundamental ideas, terminology, and techniques for solving applied problems in classification, regression, clustering, density estimation, and dimension reduction. The design principles behind the techniques are emphasized, including the bias-variance trade-off and its influence on the design of ensemble methods. Understanding these principles leads to more flexible and successful applications. Machine Learning: a Concise Introduction also includes methods for optimization, risk estimation, and model selection— essential elements of most applied projects. 

This important resource: Illustrates many classification methods with a single, running example, highlighting similarities and differences between methods + Presents R source code which shows how to apply and interpret many of the techniques covered + Includes many thoughtful exercises as an integral part of the text, with an appendix of selected solutions + Contains useful information for effectively communicating with clients.

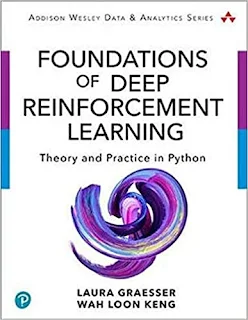
Laura Graesser, Wah Loon Keng ... 416 pages - ISBN-13: 978-0135172384 - ISBN-10: 0135172381 ... Publisher: Addison-Wesley Professional; (December, 2019) - Language: English.


The Contemporary Introduction to Deep Reinforcement Learning that Combines Theory and Practice: Deep reinforcement learning (deep RL) combines deep learning and reinforcement learning, in which artificial agents learn to solve sequential decision-making problems. In the past decade deep RL has achieved remarkable results on a range of problems, from single and multiplayer games–such as Go, Atari games, and DotA 2–to robotics.

Foundations of Deep Reinforcement Learning is an introduction to deep RL that uniquely combines both theory and implementation. It starts with intuition, then carefully explains the theory of deep RL algorithms, discusses implementations in its companion software library SLM Lab, and finishes with the practical details of getting deep RL to work. This guide is ideal for both computer science students and software engineers who are familiar with basic machine learning concepts and have a working understanding of Python: Understand each key aspect of a deep RL problem + Explore policy- and value-based algorithms, including REINFORCE, SARSA, DQN, Double DQN, and Prioritized Experience Replay (PER) + Delve into combined algorithms, including Actor-Critic and Proximal Policy Optimization (PPO) + Understand how algorithms can be parallelized synchronously and asynchronously + Run algorithms in SLM Lab and learn the practical implementation details for getting deep RL to work + Explore algorithm benchmark results with tuned hyperparameters + Understand how deep RL environments are designed.

Lisa Daniels, Nicholas W. Minot ... 392 pages - ISBN-10: 1506371833 - ISBN-13: 978-1506371832 ... Publisher : SAGE Publications; (January, 2019) - Language: English.


An Introduction to Statistics and Data Analysis Using Stata by Lisa Daniels and Nicholas Minot provides a step-by-step introduction for statistics, data analysis, or research methods classes with Stata. Concise descriptions emphasize the concepts behind statistics for students rather than the derivations of the formulas. With real-world examples from a variety of disciplines and extensive detail on the commands in Stata, this text provides an integrated approach to research design, statistical analysis, and report writing for social science students.

Richard McElreath ... 612 pages - ISBN-10: 036713991X - ISBN-13: 978-0367139919 ... Publisher : Chapman and Hall/CRC; 2nd Edition (March, 2020) - Language: English.


Statistical Rethinking: A Bayesian Course with Examples in R and Stan builds your knowledge of and confidence in making inferences from data. Reflecting the need for scripting in today's model-based statistics, the book pushes you to perform step-by-step calculations that are usually automated. This unique computational approach ensures that you understand enough of the details to make reasonable choices and interpretations in your own modeling work. The text presents causal inference and generalized linear multilevel models from a simple Bayesian perspective that builds on information theory and maximum entropy. The core material ranges from the basics of regression to advanced multilevel models. It also presents measurement error, missing data, and Gaussian process models for spatial and phylogenetic confounding.

The second edition emphasizes the directed acyclic graph (DAG) approach to causal inference, integrating DAGs into many examples. The new edition also contains new material on the design of prior distributions, splines, ordered categorical predictors, social relations models, cross-validation, importance sampling, instrumental variables, and Hamiltonian Monte Carlo. It ends with an entirely new chapter that goes beyond generalized linear modeling, showing how domain-specific scientific models can be built into statistical analyses. Features: Integrates working code into the main text + Illustrates concepts through worked data analysis examples + Emphasizes understanding assumptions and how assumptions are reflected in code + Offers more detailed explanations of the mathematics in optional sections + Presents examples of using the dagitty R package to analyze causal graphs + Provides the rethinking R package on the author's website and on GitHub

Alan C. Acock ... 500 pages - ISBN-10: 1597181420 - ISBN-13: 978-1597181426 ... Publisher: Stata Press; 4th Edition (April, 2014) - Language: English.


A Gentle Introduction to Stata, Fourth Edition is for people who need to learn Stata but who may not have a strong background in statistics or prior experience with statistical software packages. After working through this book, you will be able to enter, build, and manage a dataset, and perform fundamental statistical analyses. This book is organized like the unfolding of a research project. You begin by learning how to enter and manage data and how to do basic descriptive statistics and graphical analysis. Then you learn how to perform standard statistical procedures from t tests, nonparametric tests, and measures of association through ANOVA, multiple regression, and logistic regression. Readers who have experience with another statistical package may benefit more by reading chapters selectively and referring to this book as needed. The fourth edition has incorporated numerous changes that were new with Stata 13. Coverage of the marginsplot command has expanded. This simplifies the construction of compelling graphs. There is a new chapter showing how to estimate path models using the sem (structural equation modeling) command. Menus have been updated, and several minor changes and corrections have been included based on suggestions from readers.

John Sall, Lee Creighton, Ann Lehman ... 628 pages - ISBN-10: 159994572X - ISBN-13: 978-1599945729 ... Publisher : SAS Publishing; 4th Edition (September, 2007) - Language: : English.


JMP Start Statistics: A Guide to Statistics and Data Analysis Using JMP, Fourth Edition, is a complete and orderly introduction to analyzing data using JMP statistical discovery software from SAS. A mix of software manual and statistics text, this book provides hands-on tutorials with just the right amount of conceptual and motivational material to illustrate how to use JMP's intuitive interface for data analysis. Each chapter features concept-specific tutorials, examples, brief reviews of concepts, step-by-step illustrations, and exercises. Written by John Sall, Lee Creighton, and Ann Lehman, this book is a great tool for statistics students or practitioners needing a software-related statistics review.

Giuseppe Bonaccorso ... 522 pages - AmazonSIN : B07CSLQGNC - Publisher : Packt Publishing; 2nd Edition (August, 2018) - Language: English.

Machine learning has gained tremendous popularity for its powerful and fast predictions with large datasets. However, the true forces behind its powerful output are the complex algorithms involving substantial statistical analysis that churn large datasets and generate substantial insight. This second edition of Machine Learning Algorithms walks you through prominent development outcomes that have taken place relating to machine learning algorithms, which constitute major contributions to the machine learning process and help you to strengthen and master statistical interpretation across the areas of supervised, semi-supervised, and reinforcement learning. Once the core concepts of an algorithm have been covered, you’ll explore real-world examples based on the most diffused libraries, such as scikit-learn, NLTK, TensorFlow, and Keras. You will discover new topics such as principal component analysis (PCA), independent component analysis (ICA), Bayesian regression, discriminant analysis, advanced clustering, and gaussian mixture.

By the end of this book, you will have studied machine learning algorithms and be able to put them into production to make your machine learning applications more innovative. What you will learn: Study feature selection and the feature engineering process + Assess performance and error trade-offs for linear regression + Build a data model and understand how it works by using different types of algorithm + Learn to tune the parameters of Support Vector Machines (SVM) + Explore the concept of natural language processing (NLP) and recommendation systems + Create a machine learning architecture from scratch. Who this book is for: Machine Learning Algorithms is for you if you are a machine learning engineer, data engineer, or junior data scientist who wants to advance in the field of predictive analytics and machine learning. Familiarity with R and Python will be an added advantage for getting the best from this book.

John Fox ... 816 pages - Publisher: SAGE Publications; 3rd edition (April, 2015) ... Language: English - ISBN-10: 1452205663 - ISBN-13: 978-1452205663.

Combining a modern, data-analytic perspective with a focus on applications in the social sciences, the Third Edition of Applied Regression Analysis and Generalized Linear Models provides in-depth coverage of regression analysis, generalized linear models, and closely related methods, such as bootstrapping and missing data. Updated throughout, this Third Edition includes new chapters on mixed-effects models for hierarchical and longitudinal data. Although the text is largely accessible to readers with a modest background in statistics and mathematics, author John Fox also presents more advanced material in optional sections and chapters throughout the book.

Abdiasis Jama ... 214 pages - Publication Date: (February, 2020) ... Language: English - AmazonSIN: B084SFJ7L9.

This study guide is written for students who are looking for understanding on statistical techniques application in their graduation research and how to analyze their data in SPSS. It is also written for practicing researchers who want to update their statistical knowledge condensed in study guide fashion with relevant examples without flooding too much mathematics. Having said that students can use this book to prepare for demanding job opportunities. The author had tried to write the guide in practical way so that students can simulate work experience while still at campus. Every statistical study tested is presented with hand calculation as well as on SPSS to reinforce interpretation of the analysis result.The study guide clearly demonstrates both in theory and in SPSS parametric test for one sample, two sample and k samples as well as their non-parametric counterparts.

Ranjan Parekh ... 426 pages - Publisher: CRC Press; (December, 2019) ... Language: English - ISBN-10: 0367184826 - ISBN-13: 978-0367184827.

This book introduces fundamental concepts and principles of 2D and 3D graphics and is written for undergraduate and postgraduate students of computer science, graphics, multimedia, and data science. It demonstrates the use of MATLAB programming for solving problems related to graphics and discusses a variety of visualization tools to generate graphs and plots. The book covers important concepts like transformation, projection, surface generation, parametric representation, curve fitting, interpolation, vector representation, and texture mapping, all of which can be used in a wide variety of educational and research fields. Theoretical concepts are illustrated using a large number of practical examples and programming codes, which can be used to visualize and verify the results.

Key Features: Covers fundamental concepts and principles of 2D and 3D graphics + Demonstrates the use of MATLAB programming for solving problems on graphics + Provides MATLAB codes as answers to specific numerical problems + Provides codes in a simple copy and execute format for the novice learner + Focuses on learning through visual representation with extensive use of graphs and plots + Helps the reader gain in-depth knowledge about the subject matter through practical examples + Contains review questions and practice problems with answers for self-evaluation

Robert Ho ... 276 pages - Publisher: Chapman and Hall/CRC; (September, 2017) ... Language: English - AmazonSIN: B075V4BVGC.

Modern statistical software provides the ability to compute statistics in a timely, orderly fashion. This introductory statistics textbook presents clear explanations of basic statistical concepts and introduces students to the IBM SPSS program to demonstrate how to conduct statistical analyses via the popular point-and-click and the "syntax file" methods. The focal point is to show students how easy it is to analyse data using SPSS once they have learned the basics.

Provides clear explanation of basic statistical concepts that provides the foundation for the beginner students’ statistical journey. Introduces the SPSS software program. Gives clear explanation of the purpose of specific statistical procedures (e.g., frequency distributions, measures of central tendencies, measures of variability, etc.). Avoids the conventional cookbook approach that contributes very little to students’ understanding of the rationale of how the correct results were obtained.The advantage of learning the IBM SPSS software package at the introductory class level is that most social sciences students will employ this program in their later years of study. This is because SPSS is one of the most popular of the many statistical packages currently available. Learning how to use this program at the very start not only familiarizes students with the utility of this program but also provides them with the experience to employ the program to conduct more complex analyses in their later years.

Nancy Whittier, Tina Wildhagen, Howard J. Gold ... 696 pages - Publisher: Rowman & Littlefield Publishers (January, 2019) ... Language: English - ISBN-10: 1538109832 - ISBN-13: 978-1538109830.

Statistics for Social Understanding: With Stata and SPSS introduces students to the way statistics is used in the social sciences--as a tool for advancing understanding of the social world. Written in an engaging and clear voice and based on the latest research on the teaching and learning of quantitative material, the text is geared to introductory students in the social sciences, including those with little quantitative background. It covers the conceptual aspects of statistics even when the mathematical details are minimized. Informed by research on teaching and learning in statistics, the book takes a universal design approach to accommodate diverse learning styles. With an early chapter on cross-tabulation, a focus on comparisons between groups throughout, and a unique chapter on causality, the text shows students the power of statistics for answering important real-world questions.

By providing thorough coverage of social science statistical topics, a balanced approach to calculation, and step-by-step directions on how to use statistical software, authors Nancy Whittier, Tina Wildhagen, and Howard J. Gold give students the ability to analyze data and explore and answer exciting questions. To accommodate changing undergraduate courses, the text incorporates examples from both Stata and SPSS in every chapter and provides practice problems of every type as well as readily available datasets for classroom use, including the General Social Survey, American National Election Study, and more. Each chapter concludes with a chapter summary, a section on using Stata, a section on using SPSS, and practice problems.

Darren George, Paul Mallery ... 402 pages - Publisher: Routledge; 16th edition (December, 2019) ... Language: English - ISBN-10: 0367174359 - ISBN-13: 978-0367174354.

IBM SPSS Statistics 26 Step by Step: A Simple Guide and Reference, sixteenth edition, takes a straightforward, step-by-step approach that makes SPSS software clear to beginners and experienced researchers alike. Extensive use of four-color screen shots, clear writing, and step-by-step boxes guide readers through the program. Output for each procedure is explained and illustrated, and every output term is defined. Exercises at the end of each chapter support students by providing additional opportunities to practice using SPSS. This book covers the basics of statistical analysis and addresses more advanced topics such as multi-dimensional scaling, factor analysis, discriminant analysis, measures of internal consistency, MANOVA (between- and within-subjects), cluster analysis, Log-linear models, logistic regression and a chapter describing residuals. Back matter includes a description of data files used in exercises, an exhaustive glossary, suggestions for further reading and a comprehensive index.

IMB SPSS Statistics 26 Step by Step is distributed in 85 countries, has been an academic best seller through most of the earlier editions, and has proved invaluable aid to thousands of researchers and students. New to this edition: Screenshots, explanations, and step-by-step boxes have been fully updated to reflect SPSS 26 + How to handle missing data has been revised and expanded and now includes a detailed explanation of how to create regression equations to replace missing data + More explicit coverage of how to report APA style statistics; this primarily shows up in the Output sections of Chapters 6 through 16, though changes have been made throughout the text.

Erik Lee Nylen, Pascal Wallisch ... 368 pages - Publisher: Academic Press; (April, 2017) ... Language: English - ISBN-10: 0128040432 - ISBN-13: 978-0128040430.

A Primer with MATLAB® and Python™ present important information on the emergence of the use of Python, a more general purpose option to MATLAB, the preferred computation language for scientific computing and analysis in neuroscience. This book addresses the snake in the room by providing a beginner’s introduction to the principles of computation and data analysis in neuroscience, using both Python and MATLAB, giving readers the ability to transcend platform tribalism and enable coding versatility.

Contact Form

Name

Email *

Message *

Powered by Blogger.