Articles by "Statistics"

Showing posts with label Statistics. Show all posts

Richard F. Gunst, Robert L. Mason ... 424 pages - Publisher: CRC Press; 1st edition (July, 1980) ... Language: English - ISBN-10: 0824769937 - ISBN-13: 978-0824769932 ...

Regression Analysis and Its Application: A Data-Oriented Approach answers the need for researchers and students who would like a better understanding of classical regression analysis. Useful either as a textbook or as a reference source, this book bridges the gap between the purely theoretical coverage of regression analysis and its practical application. The book presents regression analysis in the general context of data analysis. Using a teach-by-example format, it contains ten major data sets along with several smaller ones to illustrate the common characteristics of regression data and properties of statistics that are employed in regression analysis. The book covers model misspecification, residual analysis, multicollinearity, and biased regression estimators. It also focuses on data collection, model assumptions, and the interpretation of parameter estimates. Complete with an extensive bibliography, Regression Analysis and Its Application is suitable for statisticians, graduate and upper-level undergraduate students, and research scientists in biometry, business, ecology, economics, education, engineering, mathematics, physical sciences, psychology, and sociology. In addition, data collection agencies in the government and private sector will benefit from the book.

Robert Nisbet, Gary Miner, Ken Yale ... 822 pages - Publisher: Academic Press; 2nd edition (November, 2017) ... Language: English - ISBN-10: 0124166326 - ISBN-13: 978-0124166325 ...

Handbook of Statistical Analysis and Data Mining Applications, Second Edition, is a comprehensive professional reference book that guides business analysts, scientists, engineers and researchers, both academic and industrial, through all stages of data analysis, model building and implementation. The handbook helps users discern technical and business problems, understand the strengths and weaknesses of modern data mining algorithms and employ the right statistical methods for practical application. This book is an ideal reference for users who want to address massive and complex datasets with novel statistical approaches and be able to objectively evaluate analyses and solutions. It has clear, intuitive explanations of the principles and tools for solving problems using modern analytic techniques and discusses their application to real problems in ways accessible and beneficial to practitioners across several areas―from science and engineering, to medicine, academia and commerce. * Includes input by practitioners for practitioners * Includes tutorials in numerous fields of study that provide step-by-step instruction on how to use supplied tools to build models * Contains practical advice from successful real-world implementations * Brings together, in a single resource, all the information a beginner needs to understand the tools and issues in data mining to build successful data mining solutions * Features clear, intuitive explanations of novel analytical tools and techniques, and their practical applications.

Ian H. Witten, Eibe Frank, Mark A. Hall, Christopher J. Pal ... 655 pages - Publisher: Morgan Kaufmann; 4th edition (October, 2016) ... Language: English - ASIN: B01MG31RL3 by Amazon ...

Data Mining: Practical Machine Learning Tools and Techniques, Fourth Edition, offers a thorough grounding in machine learning concepts, along with practical advice on applying these tools and techniques in real-world data mining situations. This highly anticipated fourth edition of the most acclaimed work on data mining and machine learning teaches readers everything they need to know to get going, from preparing inputs, interpreting outputs, evaluating results, to the algorithmic methods at the heart of successful data mining approaches. Extensive updates reflect the technical changes and modernizations that have taken place in the field since the last edition, including substantial new chapters on probabilistic methods and on deep learning. Accompanying the book is a new version of the popular WEKA machine learning software from the University of Waikato. Authors Witten, Frank, Hall, and Pal include today's techniques coupled with the methods at the leading edge of contemporary research.

Giuseppe Ciaburro ... 422 pages - Publisher: Packt Publishing; (January, 2018) ... Language: English - ISBN-10: 178862730X - ISBN-13: 978-1788627306 ...

Regression analysis is a statistical process which enables prediction of relationships between variables. The predictions are based on the casual effect of one variable upon another. Regression techniques for modeling and analyzing are employed on large set of data in order to reveal hidden relationship among the variables. This book will give you a rundown explaining what regression analysis is, explaining you the process from scratch. The first few chapters give an understanding of what the different types of learning are - supervised and unsupervised, how these learnings differ from each other. We then move to covering the supervised learning in details covering the various aspects of regression analysis. The outline of chapters are arranged in a way that gives a feel of all the steps covered in a data science process - loading the training dataset, handling missing values, EDA on the dataset, transformations and feature engineering, model building, assessing the model fitting and performance, and finally making predictions on unseen datasets. Each chapter starts with explaining the theoretical concepts and once the reader gets comfortable with the theory, we move to the practical examples to support the understanding. The practical examples are illustrated using R code including the different packages in R such as R Stats, Caret and so on. Each chapter is a mix of theory and practical examples. By the end of this book you will know all the concepts and pain-points related to regression analysis, and you will be able to implement your learning in your projects.

Hossein Riazoshams, Habshah Midi, Gebrenegus Ghilagaber ... 264 pages - Publisher: Wiley; 1st edition (June, 2018) ... Language: English - ASIN: B07DP92FBT by Amazon ...

The first book to discuss robust aspects of nonlinear regression—with applications using R software: Robust Nonlinear Regression: with Applications using R covers a variety of theories and applications of nonlinear robust regression. It discusses both parts of the classic and robust aspects of nonlinear regression and focuses on outlier effects. It develops new methods in robust nonlinear regression and implements a set of objects and functions in S-language under SPLUS and R software. The software covers a wide range of robust nonlinear fitting and inferences, and is designed to provide facilities for computer users to define their own nonlinear models as an object, and fit models using classic and robust methods as well as detect outliers. The implemented objects and functions can be applied by practitioners as well as researchers. The book offers comprehensive coverage of the subject in 9 chapters: Theories of Nonlinear Regression and Inference; Introduction to R; Optimization; Theories of Robust Nonlinear Methods; Robust and Classical Nonlinear Regression with Autocorrelated and Heteroscedastic errors; Outlier Detection; R Packages in Nonlinear Regression; A New R Package in Robust Nonlinear Regression; and Object Sets. The first comprehensive coverage of this field covers a variety of both theoretical and applied topics surrounding robust nonlinear regression
Addresses some commonly mishandled aspects of modeling. R packages for both classical and robust nonlinear regression are presented in detail in the book and on an accompanying websiteRobust Nonlinear Regression: with Applications using R is an ideal text for statisticians, biostatisticians, and statistical consultants, as well as advanced level students of statistics.

R. Lyman Ott, Micheal T. Longnecker ... 1296 pages - Publisher: Cengage Learning; 7th edition (June, 2015) ... Language: English - ISBN-10: 1305269470 - ISBN-13: 978-1305269477 ...

Ott and Longnecker's AN INTRODUCTION TO STATISTICAL METHODS AND DATA ANALYSIS, Seventh Edition, provides a broad overview of statistical methods for advanced undergraduate and graduate students from a variety of disciplines who have little or no prior course work in statistics. The authors teach students to solve problems encountered in research projects, to make decisions based on data in general settings both within and beyond the university setting, and to become critical readers of statistical analyses in research papers and news reports. The first eleven chapters present material typically covered in an introductory statistics course, as well as case studies and examples that are often encountered in undergraduate capstone courses. The remaining chapters cover regression modeling and design of experiments.

Conrad Carlberg ... 272 pages - Publisher: Que Publishing; 1st edition (November, 2016) ... Language: English - ISBN-10: 0789757850 - ISBN-13: 978-0789757852 ...

Microsoft Excel can perform many statistical analyses, but thousands of business users and analysts are now reaching its limits. R, in contrast, can perform virtually any imaginable analysis—if you can get over its learning curve. In R for Microsoft® Excel Users, Conrad Carlberg shows exactly how to get the most from both programs. Drawing on his immense experience helping organizations apply statistical methods, Carlberg reviews how to perform key tasks in Excel, and then guides you through reaching the same outcome in R—including which packages to install and how to access them. Carlberg offers expert advice on when and how to use Excel, when and how to use R instead, and the strengths and weaknesses of each tool. Writing in clear, understandable English, Carlberg combines essential statistical theory with hands-on examples reflecting real-world challenges. By the time you’ve finished, you’ll be comfortable using R to solve a wide spectrum of problems—including many you just couldn’t handle with Excel. Contents: • Smoothly transition to R and its radically different user interface • Leverage the R community’s immense library of packages • Efficiently move data between Excel and R • Use R’s DescTools for descriptive statistics, including bivariate analyses • Perform regression analysis and statistical inference in R and Excel • Analyze variance and covariance, including single-factor and factorial ANOVA • Use R’s mlogit package and glm function for Solver-style logistic regression • Analyze time series and principal components with R and Excel.

Conrad Carlberg ... 368 pages - Publisher: Que Publishing; 1st edition (May, 2016) ... Language: English - ISBN-10: 0789756552 - ISBN-13: 978-0789756558 ...

This is today’s most complete guide to regression analysis with Microsoft® Excel for any business analytics or research task. Drawing on 25 years of advanced statistical experience, Microsoft MVP Conrad Carlberg shows how to use Excel’s regression-related worksheet functions to perform a wide spectrum of practical analyses. Carlberg clearly explains all the theory you’ll need to avoid mistakes, understand what your regressions are really doing, and evaluate analyses performed by others. From simple correlations and t-tests through multiple analysis of covariance, Carlberg offers hands-on, step-by-step walkthroughs using meaningful examples. He discusses the consequences of using each option and argument, points out idiosyncrasies and controversies associated with Excel’s regression functions, and shows how to use them reliably in fields ranging from medical research to financial analysis to operations.

You don’t need expensive software or a doctorate in statistics to work with regression analyses. Microsoft Excel has all the tools you need—and this book has all the knowledge! Understand what regression analysis can and can’t do, and why + Master regression-based functions built into all recent versions of Excel + Work with correlation and simple regression + Make the most of Excel’s improved LINEST() function + Plan and perform multiple regression + Distinguish the assumptions that matter from the ones that don’t + Extend your analysis options by using regression instead of traditional analysis of variance + Add covariates to your analysis to reduce bias and increase statistical power.

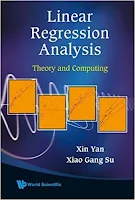
Xin Yan, Xiao Gang Su ... 328 pages - Publisher: World Scientific; 1st edition (June, 2009) ... Language: English - ISBN-10: 9812834109 - ISBN-13: 978-9812834102 ...

This volume presents in detail the fundamental theories of linear regression analysis and diagnosis, as well as the relevant statistical computing techniques so that readers are able to actually model the data using the methods and techniques described in the book. It covers the fundamental theories in linear regression analysis and is extremely useful for future research in this area. The examples of regression analysis using the Statistical Application System (SAS) are also included. This book is suitable for graduate students who are either majoring in statistics/biostatistics or using linear regression analysis substantially in their subject fields.

David E. Hiebeler ... 233 pages - Publisher: Chapman and Hall/CRC; (June, 2015) ... Language: English - ISBN-10: 1466568380 - ISBN-13: 978-1466568389 ... 

The First Book to Explain How a User of R or MATLAB Can Benefit from the Other: In today’s increasingly interdisciplinary world, R and MATLAB® users from different backgrounds must often work together and share code. R and MATLAB® is designed for users who already know R or MATLAB and now need to learn the other platform. The book makes the transition from one platform to the other as quick and painless as possible. Enables R and MATLAB Users to Easily Collaborate and Share Code: The author covers essential tasks, such as working with matrices and vectors, writing functions and other programming concepts, graphics, numerical computing, and file input/output. He highlights important differences between the two platforms and explores common mistakes that are easy to make when transitioning from one platform to the other.

Statistician v2.00.01.79 [Size: 4.32 MB] ... Statistician is a comprehensive yet simple to use add-in for Microsoft Excel 2007 or later. The software performs a high quality statistical analysis based on a series of easy-to-use forms, activated via the Excel tab. Statistician works in a unique way when compared to other Excel based statistical analysis software. Most importantly, it allows the user to store a data set and perform multiple analyzes on it, a method used by all high end statistical software, but lacking in many other Excel add-ins that require the user to re-select data over and over again when they return to the spreadsheet. Many customers, having used alternative statistical data analysis in the past, are amazed by not only how powerful and reliable Statistician is, but how fast and easy it is to use.

Features: – conduct statistical analyzes different – a set of standard tests – tests of variance – test for parametric – Test normalization – the Mac is to sort and grade data – a logistic regression model and Probiotic regression model – Sampling – Optimization – Provide a summary of statistical results. Calculations: ANOVA - Multiple Regression Analysis - Variance Tests - Normality Tests - Non Parametric Tests - Chi Square Tests - Binary Models - Count Model - Multivariate Analysis - Time Series Analysis.

A Boltzmann machine is a network of symmetrically connected, neuron-like units that make stochastic decisions about whether to be on or off. Boltzmann machines have a simple learning algorithm that allows them to discover interesting features that represent complex regularities in the training data. The learning algorithm is very slow in networks with many layers of feature detectors, but it is fast in "restricted Boltzmann machines" that have a single layer of feature detectors. Many hidden layers can be learned efficiently by composing restricted Boltzmann machines, using the feature activations of one as the training data for the next. Boltzmann machines are used to solve two quite different computational problems. For a search problem, the weights on the connections are fixed and are used to represent a cost function. The stochastic dynamics of a Boltzmann machine then allow it to sample binary state vectors that have low values of the cost function. For a learning problem, the Boltzmann machine is shown a set of binary data vectors and it must learn to generate these vectors with high probability. To do this, it must find weights on the connections so that, relative to other possible binary vectors, the data vectors have low values of the cost function. To solve a learning problem, Boltzmann machines make many small updates to their weights, and each update requires them to solve many different search problems.

George E. P. Box,‎ George C. Tiao ... 588 pages - Publisher: Addison-Wesley Publishing; 1st edition (June, 1973) ... Language: English - ISBN-10: 0201006227 - ISBN-13: 978-0201006223 ...

Its main objective is to examine the application and relevance of Bayes' theorem to problems that arise in scientific investigation in which inferences must be made regarding parameter values about which little is known a prior. Begins with a discussion of some important general aspects of the Bayesian approach such as the choice of prior distribution, particularly non-informative prior distribution, the problem of nuisance parameters and the role of sufficient statistics, followed by many standard problems concerned with the comparison of location and scale parameters. The main thrust is an investigation of questions with appropriate analysis of mathematical results which are illustrated with numerical examples, providing evidence of the value of the Bayesian approach.

Nataraj Venkataramanan, Ashwin Shriram ... 232 pages - Publisher: Chapman and Hall/CRC; (August, 2016) ... Language: English - ISBN-10: 1498721044 - ISBN-13: 978-1498721042

The book covers data privacy in depth with respect to data mining, test data management, synthetic data generation etc. It formalizes principles of data privacy that are essential for good anonymization design based on the data format and discipline. The principles outline best practices and reflect on the conflicting relationship between privacy and utility. From a practice standpoint, it provides practitioners and researchers with a definitive guide to approach anonymization of various data formats, including multidimensional, longitudinal, time-series, transaction, and graph data. In addition to helping CIOs protect confidential data, it also offers a guideline as to how this can be implemented for a wide range of data at the enterprise level.

F. M. Dekking, C. Kraaikamp ... 488 pages - Publisher: Springer; (February, 2007) ... Language: English - ISBN-10: 1852338962 - ISBN-13: 978-1852338961 ...

Probability and Statistics are studied by most science students, usually as a second- or third-year course. Many current texts in the area are just cookbooks and, as a result, students do not know why they perform the methods they are taught, or why the methods work. The strength of this book is that it readdresses these shortcomings; by using examples, often from real-life and using real data, the authors can show how the fundamentals of probabilistic and statistical theories arise intuitively. It provides a tried and tested, self-contained course, that can also be used for self-study. A Modern Introduction to Probability and Statistics has numerous quick exercises to give direct feedback to the students. In addition the book contains over 350 exercises, half of which have answers, of which half have full solutions. A website at www.springeronline.com/1-85233-896-2 gives access to the data files used in the text, and, for instructors, the remaining solutions. The only pre-requisite for the book is a first course in calculus; the text covers standard statistics and probability material, and develops beyond traditional parametric models to the Poisson process, and on to useful modern methods such as the bootstrap. This will be a key text for undergraduates in Computer Science, Physics, Mathematics, Chemistry, Biology and Business Studies who are studying a mathematical statistics course, and also for more intensive engineering statistics courses for undergraduates in all engineering subjects.

Rafael A. Irizarry, Michael I. Love ... 376 pages - Publisher: Chapman and Hall/CRC; 1st edition (August, 2016) ... Language: English - ISBN-10: 1498775675 - ISBN-13: 978-1498775670 ...

This book covers several of the statistical concepts and data analytic skills needed to succeed in data-driven life science research. The authors proceed from relatively basic concepts related to computed p-values to advanced topics related to analyzing highthroughput data. They include the R code that performs this analysis and connect the lines of code to the statistical and mathematical concepts explained.

John J. Kinney ... 480 pages - Publisher: Wiley; 2nd edition (December, 2014) ... Language: English - ISBN-10: 1118947088 - ISBN-13: 978-1118947081.

Thoroughly updated, Probability: An Introduction with Statistical Applications, Second Edition features a comprehensive exploration of statistical data analysis as an application of probability. The new edition provides an introduction to statistics with accessible coverage of reliability, acceptance sampling, confidence intervals, hypothesis testing, and simple linear regression. Encouraging readers to develop a deeper intuitive understanding of probability, the author presents illustrative geometrical presentations and arguments without the need for rigorous mathematical proofs. The Second Edition features interesting and practical examples from a variety of engineering and scientific fields, as well as: Over 880 problems at varying degrees of difficulty allowing readers to take on more challenging problems as their skill levels increase + Chapter-by-chapter projects that aid in the visualization of probability distributions + New coverage of statistical quality control and quality production + An appendix dedicated to the use of Mathematica® and a companion website containing the referenced data sets. Featuring a practical and real-world approach, this textbook is ideal for a first course in probability for students majoring in statistics, engineering, business, psychology, operations research, and mathematics. Probability: An Introduction with Statistical Applications, Second Edition is also an excellent reference for researchers and professionals in any discipline who need to make decisions based on data as well as readers interested in learning how to accomplish effective decision making from data.

Mike McGrath ... 192 pages - Publisher: In Easy Steps Limited; (March, 2018) ... Language: English - ISBN-10: 1840787953 - ISBN-13: 978-1840787955 ...

The R language is widely used by statisticians for data analysis, and the popularity of R programming has therefore increased substantially in recent years. The emerging Internet of Things (IoT) gathers increasing amounts of data that can be analyzed to gain useful insights into trends. R for Data Analysis in easy steps has an easy-to-follow style that will appeal to anyone who wants to produce graphic visualizations to gain insights from gathered data. R for Data Analysis in easy steps begins by explaining core programming principles of the R programming language, which stores data in “vectors” from which simple graphs can be plotted. Next, the book describes how to create “matrices” to store and manipulate data from which graphs can be plotted to provide better insights. This book then demonstrates how to create “data frames” from imported data sets, and how to employ the “Grammar of Graphics” to produce advanced visualizations that can best illustrate useful insights from your data. R for Data Analysis in easy steps contains separate chapters on the major features of the R programming language. There are complete example programs that demonstrate how to create Line graphs, Bar charts, Histograms, Scatter graphs, Box plots, and more. The code for each R script is listed, together with screenshots that illustrate the actual output when that script has been executed. The free, downloadable example R code is provided for clearer understanding. By the end of this book you will have gained a sound understanding of R programming, and be able to write your own scripts that can be executed to produce graphic visualizations for data analysis. You need have no previous knowledge of any programming language, so it's ideal for the newcomer to computer programming.

Géza Schay ... 385 pages - Publisher: Birkhäuser; 2nd edition (June, 2016) ... Language: English - ISBN-10: 3319306189 - ISBN-13: 978-3319306186 ...

Now in its second edition, this textbook serves as an introduction to probability and statistics for non-mathematics majors who do not need the exhaustive detail and mathematical depth provided in more comprehensive treatments of the subject. The presentation covers the mathematical laws of random phenomena, including discrete and continuous random variables, expectation and variance, and common probability distributions such as the binomial, Poisson, and normal distributions. More classical examples such as Montmort's problem, the ballot problem, and Bertrand’s paradox are now included, along with applications such as the Maxwell-Boltzmann and Bose-Einstein distributions in physics. Key features in new edition: * 35 new exercises. * Expanded section on the algebra of sets. * Expanded chapters on probabilities to include more classical examples. * New section on regression. * Online instructors' manual containing solutions to all exercises. Advanced undergraduate and graduate students in computer science, engineering, and other natural and social sciences with only a basic background in calculus will benefit from this introductory text balancing theory with applications.

Géza Schay ... 318 pages - Publisher: Birkhäuser; (August, 2007) ... Language: English - ISBN-10: 0817644970 - ISBN-13: 978-0817644970 ...

Introduction to Probability with Statistical Applications targets non-mathematics students, undergraduates and graduates, who do not need an exhaustive treatment of the subject. The presentation is rigorous and contains theorems and proofs, and linear algebra is largely avoided so only a minimal amount of multivariable calculus is needed. The book contains clear definitions, simplified notation and techniques of statistical analysis, which combined with well-chosen examples and exercises, motivate the exposition. Theory and applications are carefully balanced. Throughout the book there are references to more advanced concepts if required.

Contact Form

Name

Email *

Message *

Powered by Blogger.